Multiple Choice
This graph shows one consumer's demand for ice cream at the student union: 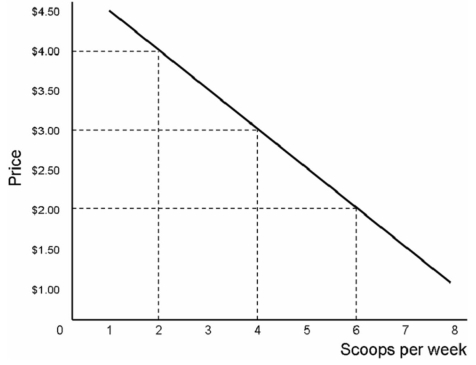
During a regular semester,there are 500 students.Each student's demand for ice cream is as depicted above.When the price of one scoop of ice cream is $2.00,those 500 students purchase a total of
A) 2,000 scoops of ice cream
B) 2,500 scoops of ice cream
C) 3,000 scoops of ice cream
D) 5,000 scoops of ice cream
Correct Answer:

Verified
Correct Answer:
Verified
Q51: During Thanksgiving you participated in a pumpkin-pie
Q52: The dollar price of a good relative
Q53: Assume the consumer is correctly applying the
Q55: Fran runs a doughnut shop in
Q57: Assume that Dusty has $30 in income,the
Q58: For the two good case,the rational spending
Q59: The rational spending rule is derived from
Q60: This graph shows one consumer's demand for
Q61: As the price of computers falls,the quantity
Q90: It is impossible for total utility to