Multiple Choice
This graph shows one consumer's demand for ice cream at the student union: 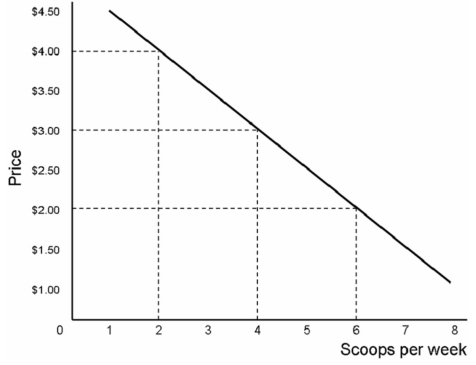
When price is $2 per scoop,each student's consumer surplus is determined by
A) the difference between maximum willingness to pay of $4.50 and $2,or $2.50.
B) the area of the triangle of dimension ($4.50 - $2.00) high and 6 long = $7.50.
C) the difference between each student's maximum price of $4.50 and $2 times the number of scoops,or $2.50 times 6 = $15.
D) The area of the triangle of dimension $4.50 high and 8 long = $18.
Correct Answer:

Verified
Correct Answer:
Verified
Q62: For two goods, A and B, the
Q85: This graph shows one consumer's demand for
Q86: Jamie's marginal utility for consuming muffins
Q87: The tendency for consumers to purchase more
Q88: The first time Michel tasted coffee,he thought
Q89: If the marginal utility of the 3<sup>rd</sup>
Q92: This graph shows one consumer's demand for
Q93: Assume that Dusty has $30 in income,the
Q94: This graph shows one consumer's demand for
Q95: Moe's parents frequently tell him how it