Multiple Choice
The following graph depicts demand. 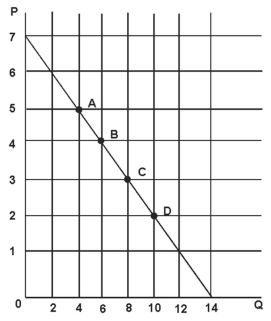
Refer to the figure above.The slope of the demand curve (if you ignore the negative sign) is:
A) 2.
B) 1.5.
C) 1.
D) 0.5.
Correct Answer:

Verified
Correct Answer:
Verified
Related Questions
Q45: When Taylor raised the price of earrings
Q46: An increase in the price of golf
Q47: If the percent change in quantity demanded
Q48: If the slope of the demand curve
Q49: If the consumers can easily switch to
Q51: If the price is $2.00 in both
Q52: If the price elasticity of demand for
Q53: The demand for a good is unitary
Q54: If the price of textbooks increases by
Q55: Suppose that the demand for electricity has