Multiple Choice
The following graph depicts demand. 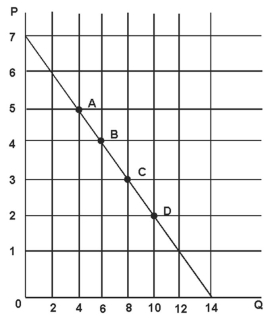
Refer to the figure above.The price elasticity of demand at point B is:
A) 3/4.
B) 4/3.
C) 3.
D) 1/3.
Correct Answer:

Verified
Correct Answer:
Verified
Related Questions
Q9: Suppose you believe that plaid flannel shirts
Q117: When the price of hot dogs is
Q120: Small budget items such as soap have
Q121: When Joe's Gas raises its prices for
Q122: Suppose you have one hour to catch
Q126: Suppose a 10% increase in the price
Q127: On a given linear demand curve,demand is
Q128: If you consume less of a good
Q129: Jeans in general have fewer close substitutes
Q130: Suppose that total expenditures for coffee reach