Multiple Choice
The following graph depicts demand. 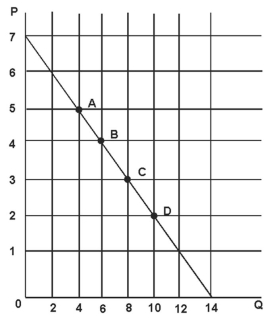
Refer to the figure above.The price elasticity of demand at point C is:
A) 3/16.
B) 16/3.
C) 3/4.
D) 3/8.
Correct Answer:

Verified
Correct Answer:
Verified
Related Questions
Q4: In surveying their alumni,State U's economics department
Q5: If income elasticity for a particular good
Q6: Oil and oil products remain the main
Q7: Big-ticket items such as refrigerators have a(n)_
Q8: Suppose that the price elasticity of supply
Q10: Suppose that a new drug has been
Q11: Lakeville is a small community that completely
Q12: Suppose that the short run price elasticity
Q13: Price elasticity of demand for transportation generally
Q14: Suppose that the company that owns all