Multiple Choice
This graph shows the marginal costs and marginal benefits associated with roadside litter clean up.Assume that the marginal cost and marginal benefit curves slope in the usual directions. 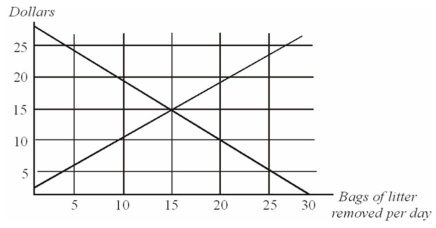
Refer to the information given above.A state initiative requiring towns to spend at least $20 per day on litter removal would be __________ because __________.
A) efficient;any and all reductions in litter are justified
B) inefficient;the marginal costs exceed the marginal benefits
C) inefficient;$20 is insufficient to remove all of the litter
D) efficient;it solves the inefficiency in the market created by the negative externality
Correct Answer:

Verified
Correct Answer:
Verified
Q19: The existence of a negative externality will
Q21: Brady owns a beachfront lot with a
Q68: Suppose that a vaccine is developed for
Q70: Which of the following is an example
Q72: Suppose that a vaccine is developed for
Q78: Suppose that a vaccine is developed for
Q87: Suppose there are ten people playing cards
Q100: Suppose there are ten people playing cards
Q137: If the market equilibrium quantity is greater
Q147: If the equilibrium quantity is equal to