Multiple Choice
This graph shows one consumer's demand for ice cream at the student union: 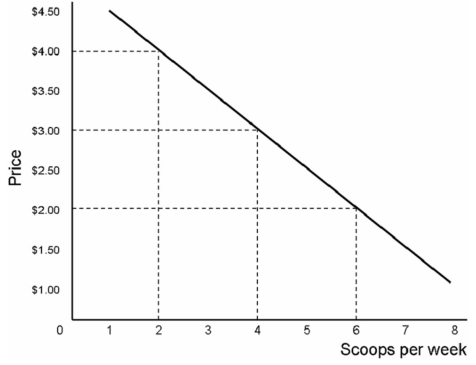
When price is $2 per scoop,each student's consumer surplus is determined by
A) the difference between maximum willingness to pay of $4.50 and $2,or $2.50.
B) the area of the triangle of dimension ($4.50 - $2.00) high and 6 long = $7.50.
C) the difference between each student's maximum price of $4.50 and $2 times the number of scoops,or $2.50 times 6 = $15.
D) The area of the triangle of dimension $4.50 high and 8 long = $18.
Correct Answer:

Verified
Correct Answer:
Verified
Q2: The fact that the average price of
Q17: This table shows demand for shoes
Q20: This table shows demand for shoes
Q22: Jamie's marginal utility for consuming muffins
Q23: When the price of a good falls,the
Q24: This table shows demand for shoes
Q26: Pat applies the rational spending rule and
Q38: Utility maximization means that people try to
Q52: The dollar price of a good relative
Q58: For the two good case,the rational spending