Multiple Choice
The following graph depicts demand. 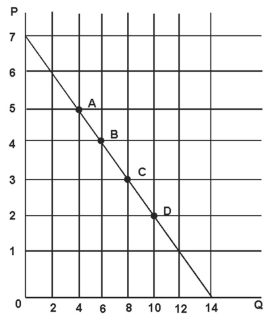
Refer to the figure above.The price elasticity of demand at point A is:
A) 5/2.
B) 5/8.
C) 2/5.
D) 8/5.
Correct Answer:

Verified
Correct Answer:
Verified
Related Questions
Q1: A change in consumers' income levels:<br>A)changes demand.<br>B)changes
Q14: Suppose that the company that owns all
Q18: For which of the following products is
Q26: If the local electricity utility wants to
Q78: The following graph depicts demand. <img src="https://d2lvgg3v3hfg70.cloudfront.net/TB3717/.jpg"
Q84: Suppose that a new drug has been
Q91: If the price of textbooks increases by
Q96: If the percentage change in the price
Q114: If the price elasticity of demand for
Q117: The responsiveness of quantity demanded for one