Multiple Choice
The following graph depicts demand. 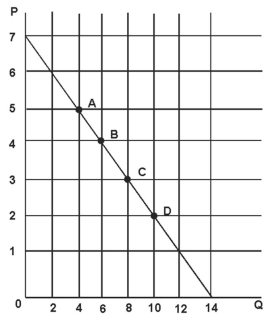
Refer to the figure above.The price elasticity of demand at point B is:
A) 3/4.
B) 4/3.
C) 3.
D) 1/3.
Correct Answer:

Verified
Correct Answer:
Verified
Related Questions
Q18: For which of the following products is
Q38: For any horizontal demand curve,the calculated price
Q43: The reason a brand name item (e.g.
Q73: For which of the following products is
Q78: The following graph depicts demand. <img src="https://d2lvgg3v3hfg70.cloudfront.net/TB3717/.jpg"
Q82: Suppose the price P on a given
Q91: If the price of textbooks increases by
Q96: If the percentage change in the price
Q112: The change in quantity supplied that results
Q117: The responsiveness of quantity demanded for one