Multiple Choice
The following graph depicts demand. 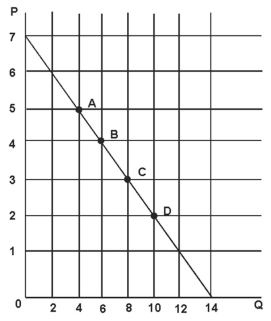
Refer to the figure above.The price elasticity of demand at point C is:
A) 3/16.
B) 16/3.
C) 3/4.
D) 3/8.
Correct Answer:

Verified
Correct Answer:
Verified
Related Questions
Q3: Suppose that the company that owns all
Q5: If income elasticity for a particular good
Q25: If the elasticity of demand for the
Q32: Suppose that a new drug has been
Q41: The following graph depicts demand. <img src="https://d2lvgg3v3hfg70.cloudfront.net/TB3717/.jpg"
Q47: If the percent change in quantity demanded
Q60: For OutBack Steakhouse,seating capacity is limited in
Q70: If the percentage change in price for
Q90: If the price elasticity of demand for
Q100: If a 10% decrease in the price