Multiple Choice
The following graph depicts demand. 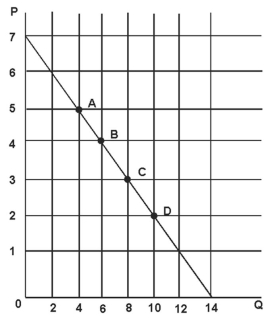
Refer to the figure above.The price elasticity of demand at point D is:
A) 5/2.
B) 1/2.
C) 2/5.
D) 2.
Correct Answer:

Verified
Correct Answer:
Verified
Related Questions
Q11: Lakeville is a small community that completely
Q13: Price elasticity of demand for transportation generally
Q17: Price elasticity of demand is often expressed
Q30: The demand for a good is inelastic
Q42: Mike knows how to make hamburgers (like
Q44: Generally speaking,demand for a good will be
Q46: An increase in the price of golf
Q85: An increase in the price of hamburger
Q93: A cross-price elasticity of -1.2 indicates that
Q109: Suppose two demand curves have a point