Multiple Choice
This graph describes the production possibilities on the island of Genovia: 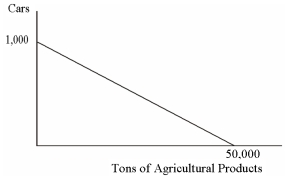
The opportunity cost of producing one ton of agricultural products in Genovia is:
A) 1,000 cars.
B) 1 car.
C) 1/5 of a car.
D) 1/50 of a car.
Correct Answer:

Verified
Correct Answer:
Verified
Related Questions
Q10: You are the Minister of Trade for
Q12: Smith and Jones comprise a two-person
Q16: This graph describes the production possibilities on
Q19: When firms engage in outsourcing, _ benefit
Q19: Lou and Alex live together and
Q34: A country may have a comparative advantage
Q43: Between the U.S. and Nepal, Nepal invests
Q75: Suppose that a further increase in specialization
Q88: If Leslie can produce two pairs of
Q112: A graph that illustrates the maximum amount