Multiple Choice
The table shows the total utility data for products X and Y. Assume that the prices of X and Y are $3 and $4, respectively, and that consumer income is $18. 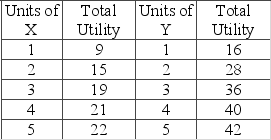 Which of the following price-quantity schedules would represent the demand for X in the $2 and $3 price range?
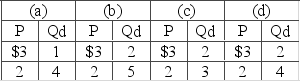
A) option A
B) option B
C) option C
D) option D
Correct Answer:

Verified
Correct Answer:
Verified
Q32: The table below shows the utility schedule
Q33: The goal of a rational consumer is
Q34: If MU<sub>a</sub>/P<sub>a</sub><sub> </sub>= 100/$35 = MU<sub>b</sub>/P<sub>b</sub><sub> </sub>=
Q36: A consumer has two basic choices: rent
Q37: The marginal utility of leisure time appears
Q40: If total utility increases as consumption of
Q40: The table shows the utility schedule for
Q142: A graph that shows the maximum combinations
Q326: Marginal utility is the accumulation of the
Q341: Suppose that a consumer who spends her