Multiple Choice
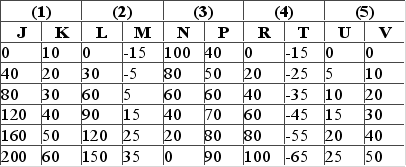
Answer the question on the basis of the following five data sets, wherein it is assumed that the variable shown on the left is the independent variable and the one on the right is the dependent variable. Assume in graphing these data that the independent variable is shown on the horizontal axis and the dependent variable on the vertical axis.  Refer to the data sets. Which of the data sets would graph as an upsloping line?
A) 1 only
B) 1, 2, and 3 only
C) 4 and 5 only
D) 1, 2, and 5 only
Correct Answer:

Verified
Correct Answer:
Verified
Q20: An assumption is usually made in a
Q41: Which of the following illustrates a macroeconomic
Q42: Which of the following is a positive
Q43: Kelly works at an ice cream shop
Q44: Which of the following is one of
Q45: The amount of pizzas that consumers want
Q47: A well-tested economic theory is often called<br>A)
Q48: Which of the following will not produce
Q49: On a production possibilities curve, the single
Q50: (Consider This) An exception to the advice