Essay
Consider the graphs that follow (the horizontal axis represents activity; the vertical axis represents total dollars). 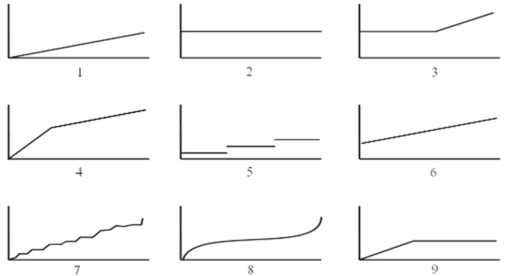 Required:
For items A-I that follow, choose the graph that best represents the cost behaviour pattern described. Note: Graphs can be used more than once.
A. Straight-line depreciation on machinery.
B. The cost of chartering a private airplane. The cost is $800 per hour for the first 6 hours of a flight; it then drops to $600 per hour.
C. The wages of table service personnel in a restaurant. The employees are part-time workers who can be called upon for as little as 4 hours at a time.
D. Weekly wages of store clerks who work 40 hours each week. One clerk is hired for every 125 sales made during the month.
E. The cost of tires used in the production of trucks.
Up to 20,000 kilowatt hours (KWH): $4,000
Above 20,000 kilowatt hours: $4,000 + $0.02 per KWH
Correct Answer:

Verified
A. 2 B. 4 ...View Answer
Unlock this answer now
Get Access to more Verified Answers free of charge
Correct Answer:
Verified
View Answer
Unlock this answer now
Get Access to more Verified Answers free of charge
Q3: Rideau Manufacturing Company has only variable costs
Q4: In regression analysis, the variable -cost component
Q5: The relevant range is that range of
Q7: Zurbrigg Copy Solutions presently leases a copy
Q10: Each of Acorn Manufacturing's production managers can
Q11: Around Town Incorporated operates a small package
Q18: Within the relevant range of activity, costs:<br>A)
Q27: Both the visual-fit and high-low methods of
Q34: Package Express, Inc. operates a small package
Q66: A variable cost that has a definitive