menu-iconExamlexExamLexServices

Discover

Ask a Question
  1. All Topics
  2. Topic
    Business
  3. Study Set
    Fundamental Managerial Accounting Concepts
  4. Exam
    Exam 5: Cost Management in an Automated Business Environment: ABC, ABM, and TQM
  5. Question
    In the Below Graph,which Shows the Relationship Among Components of Quality
Solved

In the Below Graph,which Shows the Relationship Among Components of Quality

Question 18

Question 18

Multiple Choice

In the below graph,which shows the relationship among components of quality cost,Line "C" depicts:
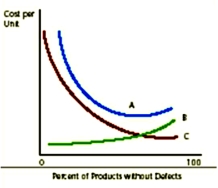
 In the below graph,which shows the relationship among components of quality cost,Line  C  depicts:   A)  failure costs. B)  internal quality cost. C)  voluntary quality failure costs. D)  prevention costs.


A) failure costs.
B) internal quality cost.
C) voluntary quality failure costs.
D) prevention costs.

Correct Answer:

verifed

Verified

Unlock this answer now
Get Access to more Verified Answers free of charge

Related Questions

Q13: Managing quality costs to achieve the highest

Q20: An activity center:<br>A) is an organizational structure

Q21: Traditional cost systems usually allocate overhead to

Q22: Which of the following is an appropriate

Q23: Costs may be classified in a

Q46: The successful implementation of an activity-based costing

Q83: The insurance cost for a large factory

Q106: Which of the following would be classified

Q115: All of the following are internal failure

Q131: An increase in prevention costs may result

Examlex

ExamLex

About UsContact UsPerks CenterHomeschoolingTest Prep

Work With Us

Campus RepresentativeInfluencers

Links

FaqPricingChrome Extension

Download The App

Get App StoreGet Google Play

Policies

Privacy PolicyTerms of ServiceHonor CodeCommunity Guidelines

Scan To Download

qr-code

Copyright © (2025) ExamLex LLC.

Privacy PolicyTerms Of ServiceHonor CodeCommunity Guidelines