Multiple Choice
Consider the following cost-volume-profit graph: 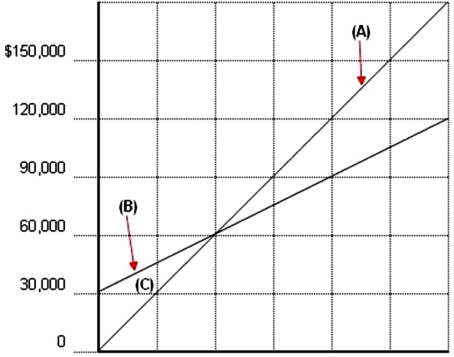 The area designated by the letter (C) represents which of the following?
A) Profit area
B) Loss area
C) Break-even area
D) Fixed cost area
Correct Answer:

Verified
Correct Answer:
Verified
Q2: When drawing a cost-volume-profit graph,how are the
Q12: Newton Company currently produces and sells 4,000
Q41: Larimore Company sales are $560,000.The company has
Q54: Pierce Company's break-even point is 12,000 units.Its
Q59: What happens to break-even point when the
Q65: Martinez Company sells one product that has
Q71: Select the correct statement regarding break-even point
Q91: Bates Company currently produces and sells 4,000
Q105: Sensitivity analysis acknowledges that profitability is often
Q125: Company A has break-even sales of 90,000