Multiple Choice
Consider the following cost-volume-profit graph: 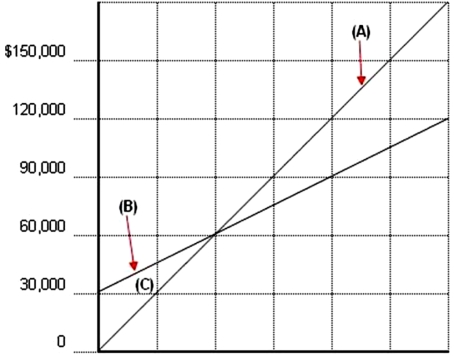 Based on the information in the graph,the breakeven point in sales dollars is approximately equal to:
A) $50,000.
B) $30,000.
C) $60,000.
D) $20,000.
Correct Answer:

Verified
Correct Answer:
Verified
Related Questions
Q15: Jarvis Company produces a product that has
Q16: Billings Company has developed the following
Q17: Select the term from the list provided
Q18: If a company is operating beyond its
Q22: The margin of safety ratio can be
Q31: Bloom Company has variable cost per unit
Q78: Which of the following statements regarding Company
Q82: Which of the following is not one
Q90: Ng Company sells one product that has
Q136: Select the correct statement regarding the contribution