Multiple Choice
In the graph below,which depicts the relationship between units produced and total cost,the dotted line depicts which type of total cost? 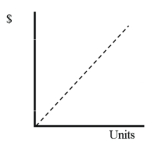
A) Variable cost
B) Fixed cost
C) Mixed cost
D) None of these
Correct Answer:

Verified
Correct Answer:
Verified
Q4: The following income statements are provided
Q6: A company with a completely fixed cost
Q13: Yankee Tours provide seven-day guided tours along
Q14: Blackstock Company manufactures digital cameras.Indicate whether
Q49: Fixed cost per unit:<br>A) decreases as production
Q79: Select the incorrect statement regarding the relationship
Q119: What is operating leverage,and how does a
Q123: Production during the current year for California
Q149: How does variable cost per unit behave
Q150: Within the relevant range,the fixed cost per