Multiple Choice
In the graph below,which depicts the relationship between units produced and unit cost,the dotted line depicts which type of cost per unit? 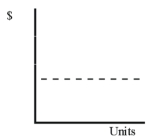
A) Variable cost
B) Fixed cost
C) Mixed cost
D) None of these
Correct Answer:

Verified
Correct Answer:
Verified
Related Questions
Q19: Southern Food Service operates six restaurants in
Q60: If managers of a company do not
Q82: The following income statement is provided
Q84: Cannon Company operates a clothing store
Q85: If a company had a mixed cost
Q88: The following information is given regarding
Q117: In order to prepare a contribution format
Q121: What advantages does the regression method of
Q128: The variable cost per unit increases in
Q134: Descriptions of cost behavior as fixed or