Multiple Choice
In the graph below,which depicts the relationship between units produced and total cost,the dotted line depicts which type of total cost? 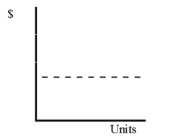
A) Variable cost
B) Fixed cost
C) Mixed cost
D) None of these
Correct Answer:

Verified
Correct Answer:
Verified
Related Questions
Q8: Describe the format of an income statement
Q15: Operating leverage enables a company to convert
Q23: For Marvin Company,the magnitude of operating leverage
Q74: No contribution margin is provided by selling
Q80: The activity base selected determines whether a
Q103: ETutor is an online tutoring service
Q104: Which characteristic is<br>A) All methods will produce
Q105: Based on the income statements shown below,which
Q106: Based on the following cost data,what
Q142: Pickard Company pays its sales staff a