Multiple Choice
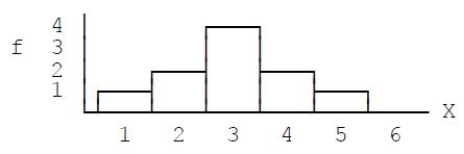 Figure 2.1
-What scale of measurement was used to measure the scores in the distribution shown in the accompanying graph,Figure 2.1?
A) nominal
B) ordinal
C) interval or ratio
D) non-numeric
Correct Answer:

Verified
Correct Answer:
Verified
Related Questions
Q4: The students in a psychology class seemed
Q5: In a grouped frequency distribution one interval
Q6: A set of scores ranges from X
Q7: For the distribution in the following
Q8: For the distribution in the following
Q10: For the following distribution,how many people
Q11: For the distribution in the following
Q12: It is customary to list the score
Q13: In a grouped frequency distribution table,one interval
Q14: Briefly explain what information is available in