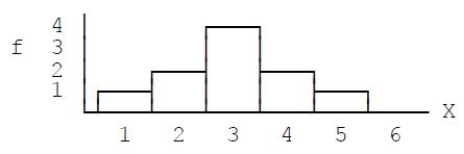
menu-iconExamlexExamLexServices

Discover

Ask a Question
  1. All Topics
  2. Topic
    Mathematics
  3. Study Set
    Statistics for The Behavioral Sciences
  4. Exam
    Exam 2: Frequency Distributions
  5. Question
    Figure 2.1 -For the Distribution in the Accompanying Graph,Figure 2.1,what Is the Is
Solved

Figure 2.1 -For the Distribution in the Accompanying Graph,Figure 2.1,what Is the Is

Question 60

Question 60

Multiple Choice

  Figure 2.1 -For the distribution in the accompanying graph,Figure 2.1,what is the value of ΣX?​ A) ​10 B) ​15 C) ​21 D) ​30 Figure 2.1
-For the distribution in the accompanying graph,Figure 2.1,what is the value of ΣX?​


A) ​10
B) ​15
C) ​21
D) ​30

Correct Answer:

verifed

Verified

Unlock this answer now
Get Access to more Verified Answers free of charge

Related Questions

Q55: In the following distribution,the scores are

Q56: The scores for a very easy exam

Q57: Find each value requested for the

Q58: For the distribution in the following

Q59: A score equal to the 5th percentile

Q61: A researcher surveys a sample of n

Q62: For the distribution in the following

Q63: What is the shape of the distribution

Q64: The normal distribution is an example of

Q65: For the distribution in the following

Examlex

ExamLex

About UsContact UsPerks CenterHomeschoolingTest Prep

Work With Us

Campus RepresentativeInfluencers

Links

FaqPricingChrome Extension

Download The App

Get App StoreGet Google Play

Policies

Privacy PolicyTerms of ServiceHonor CodeCommunity Guidelines

Scan To Download

qr-code

Copyright © (2025) ExamLex LLC.

Privacy PolicyTerms Of ServiceHonor CodeCommunity Guidelines