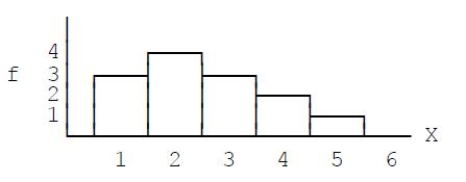
menu-iconExamlexExamLexServices

Discover

Ask a Question
  1. All Topics
  2. Topic
    Mathematics
  3. Study Set
    Statistics for The Behavioral Sciences
  4. Exam
    Exam 2: Frequency Distributions
  5. Question
    Figure 2-2 -What Is the Shape for the Distribution Shown in the in the Accompanying
Solved

Figure 2-2 -What Is the Shape for the Distribution Shown in the in the Accompanying

Question 44

Question 44

Multiple Choice

  Figure 2-2 -What is the shape for the distribution shown in the accompanying graph in Figure 2.2?​ A) ​positively skewed B) ​negatively skewed C) ​symmetrical D) ​normal Figure 2-2
-What is the shape for the distribution shown in the accompanying graph in Figure 2.2?​


A) ​positively skewed
B) ​negatively skewed
C) ​symmetrical
D) ​normal

Correct Answer:

verifed

Verified

Unlock this answer now
Get Access to more Verified Answers free of charge

Related Questions

Q39: ​ <span class="ql-formula" data-value="\begin{array} {

Q40: If a set of exam scores forms

Q41: A grouped frequency distribution table lists one

Q42: What is the total number of

Q43: For the distribution in the following

Q45: What kind of frequency distribution graph shows

Q46: For the following distribution of scores,SX<sup>2</sup>

Q47: What term is used to describe the

Q48: <img src="https://d2lvgg3v3hfg70.cloudfront.net/TB2208/.jpg" alt=" Figure 2-2 -A

Q49: For the following distribution,what is the

Examlex

ExamLex

About UsContact UsPerks CenterHomeschoolingTest Prep

Work With Us

Campus RepresentativeInfluencers

Links

FaqPricingChrome Extension

Download The App

Get App StoreGet Google Play

Policies

Privacy PolicyTerms of ServiceHonor CodeCommunity Guidelines

Scan To Download

qr-code

Copyright © (2025) ExamLex LLC.

Privacy PolicyTerms Of ServiceHonor CodeCommunity Guidelines