Multiple Choice
Curve B below represents the oxygen-hemoglobin dissociation curve for normal body temperature,arterial hydrogen ion concentration,and DPG concentration. (mm Hg) 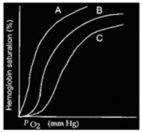
A) Curve A may represent the dissociation at higher than normal arterial hydrogen ion concentration
B) Curve C may represent the dissociation at lower than normal body temperature
C) Curve A may represent the dissociation at very low DPG levels
D) Both curve A may represent the dissociation at higher than normal arterial hydrogen ion concentration and curve C may represent the dissociation at lower than normal body temperature are correct
E) Both curve A may represent the dissociation at higher than normal arterial hydrogen ion concentration and curve A may represent the dissociation at very low DPG levels are correct
Correct Answer:

Verified
Correct Answer:
Verified
Q51: Deoxyhemoglobin binds bicarbonate ion better than oxyhemoglobin
Q80: At sea level <span class="ql-formula"
Q81: Action potentials in neurons in the inhalatory/inspiratory
Q82: Chemoreceptors include<br>A)Hair cells in the cochlea<br>B)Receptors in
Q83: Compared to normal people,people suffering from
Q86: Regarding the partial pressures of O<sub>2</sub>
Q87: The majority of hydrogen ions generated in
Q88: Regarding the relationships between the rates
Q89: Which of the following statements about
Q90: The levels of rate and depth of