Multiple Choice
The Following Questions Refer to the graph below. 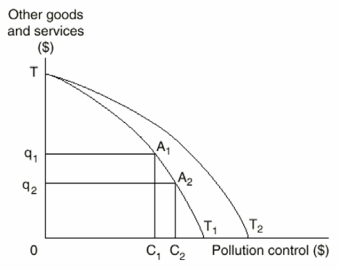
-Which of the following could explain a shift in the production possibilities curve from TT1 to TT2?
A) Over-utilization of pollution control activities
B) Better techniques of pollution control
C) Higher prices for other goods and services
D) Increased benefits from pollution control
E) Better technology for producing other goods and services
Correct Answer:

Verified
Correct Answer:
Verified
Q118: It is efficient for regulatory bodies to
Q119: Following Questions are based on the following
Q120: To date,there has been no formal use
Q121: Air pollution did not cause great concern
Q122: Deodorant is an example of a collectively
Q123: Complete elimination of pollution is economically rational
Q124: When there are no externalities,equilibrium in a
Q126: Pollution should be completely eliminated<br>A)When the marginal
Q127: When the marginal private cost of an
Q128: The market output level tends to be