Multiple Choice
The Following Questions Refer to the graph below. 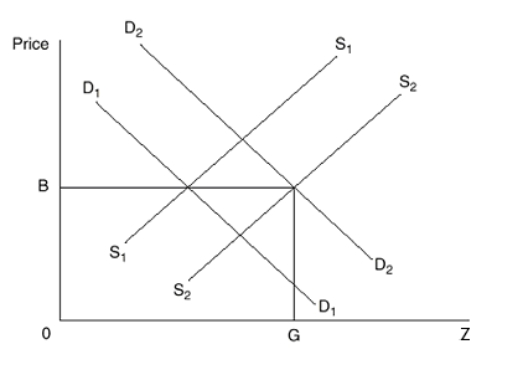
-Assume that the current market demand and supply curves for Z are D1 and S1 and there are positive social spillovers associated with the consumption of Z.Which curve could represent the MSB curve for Z?
A) D1
B) D2
C) S1
D) S2
E) None of the above
Correct Answer:

Verified
Correct Answer:
Verified
Q40: Following Questions are based on the following
Q41: The efficient level of pollution is zero
Q42: If a pollution tax is placed on
Q43: The level of pollution increases when<br>A)A person
Q44: Costs incurred by the producer to buy
Q46: When pollution is not regulated in the
Q47: If all benefits from consuming a good
Q48: The costs of pollution control to a
Q49: Pollution is an example of a negative
Q50: Complete elimination of pollution would only make