Multiple Choice
Exhibit 5.4
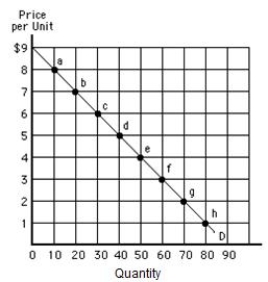
-Refer to Exhibit 5.4,which shows a downward-sloping linear demand curve.Between points b and c price decreases by $1,quantity demanded increases by 10 units,_____
A) total revenue decreases by $1, and demand is elastic.
B) total revenue decreases by $1, and demand is inelastic.
C) total revenue increases by $40, and demand is elastic.
D) total revenue increases by $40, and demand is inelastic.
E) and total revenue increases by $80.
Correct Answer:

Verified
Correct Answer:
Verified
Q71: Table 5.2<br> <span class="ql-formula" data-value="\begin{array}{c}\begin{array}{lll}\\
Q72: Exhibit 5.3<br> <img src="https://d2lvgg3v3hfg70.cloudfront.net/TB1208/.jpg" alt="Exhibit 5.3
Q73: If the cross-price elasticity of demand between
Q75: A change in the price of paper
Q77: Exhibit 5.3<br> <img src="https://d2lvgg3v3hfg70.cloudfront.net/TB1208/.jpg" alt="Exhibit 5.3
Q78: Exhibit 5.3<br> <img src="https://d2lvgg3v3hfg70.cloudfront.net/TB1208/.jpg" alt="Exhibit 5.3
Q79: What is the effect of a 10
Q80: Exhibit 5.7<br> <img src="https://d2lvgg3v3hfg70.cloudfront.net/TB1208/.jpg" alt="Exhibit 5.7
Q81: The demand curve for a good that
Q242: If demand is elastic, a decrease in