Multiple Choice
Exhibit 5.9
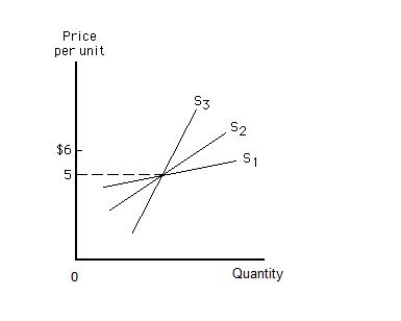
-Refer to Exhibit 5.9,which shows three upward-sloping linear supply curves.Which of the following supply curves is the most elastic and which is the least elastic between the prices of $5 and $6?
A) S1 is the most elastic; S2 is the least elastic.
B) S1 is the most elastic; S3 is the least elastic.
C) S3 is the most elastic; S1 is the least elastic.
D) S3 is the most elastic; S2 is the least elastic.
E) S2 is the most elastic; S3 is the least elastic.
Correct Answer:

Verified
Correct Answer:
Verified
Q80: Elasticity rises as price falls along a
Q161: Table 5.4<br> <span class="ql-formula" data-value="\begin{array}{l}\quad\quad\quad\quad\quad\underline{\text
Q162: Which of the following goods will have
Q163: The price elasticity of demand helps determine
Q164: What is the effect of a 10
Q165: The demand for a good is elastic
Q168: If quantity increases by 15 percent when
Q169: The supply of a product will be
Q170: Exhibit 5.10<br> <img src="https://d2lvgg3v3hfg70.cloudfront.net/TB1208/.jpg" alt="Exhibit 5.10
Q171: Which of the following is correct regarding