Multiple Choice
Exhibit 7.2
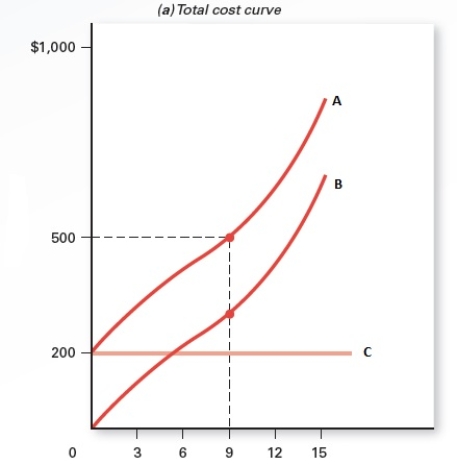
-Refer to Exhibit 7.2,which shows different cost curves.What does the difference between curve A and curve B at a total cost of $500 and an output of 9 represent?
A) variable cost
B) fixed cost
C) total cost
D) marginal cost
E) average total cost
Correct Answer:

Verified
Correct Answer:
Verified
Q171: If a firm's accounting profit is positive,its
Q172: Table 7.3<br> <span class="ql-formula" data-value="\begin{array}
Q173: Suppose Ripco owns the building from which
Q174: Total cost is calculated as _<br>A)FC +
Q175: Exhibit 7.5<br> <img src="https://d2lvgg3v3hfg70.cloudfront.net/TB1208/.jpg" alt="Exhibit 7.5
Q178: Exhibit 7.3<br> <img src="https://d2lvgg3v3hfg70.cloudfront.net/TB1208/.jpg" alt="Exhibit 7.3
Q179: Exhibit 7.1<br> <img src="https://d2lvgg3v3hfg70.cloudfront.net/TB1208/.jpg" alt="Exhibit 7.1
Q180: Doubling the circumference of an oil pipeline
Q181: Harvey develops gaming apps from home instead
Q211: Total cost is calculated as<br>A)average fixed cost