Multiple Choice
Exhibit 8.2
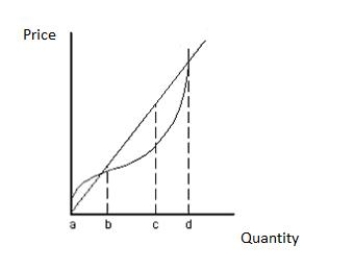
-Refer to Exhibit 8.2.The shape of the total cost curve between the output levels represented by points a and b reflects _____
A) fixed costs.
B) increasing profits.
C) diminishing marginal returns.
D) increasing marginal returns.
E) economies of scale.
Correct Answer:

Verified
Correct Answer:
Verified
Q54: Table 8.1<br> <span class="ql-formula" data-value="\begin{array}
Q55: Exhibit 8.12<br> <img src="https://d2lvgg3v3hfg70.cloudfront.net/TB1208/.jpg" alt="Exhibit 8.12
Q56: Mary Ann and Donna provide lawn mowing
Q57: Exhibit 8.1<br> <img src="https://d2lvgg3v3hfg70.cloudfront.net/TB1208/.jpg" alt="Exhibit 8.1
Q60: Claude's Copper Clappers sells clappers for $40
Q61: The total revenue curve for a perfectly
Q62: Resources are efficiently allocated when production occurs
Q63: In a perfectly competitive industry,we are likely
Q64: If new firms enter a perfectly competitive
Q233: Marginal revenue is the change in total