Multiple Choice
Marketing Dashboard Map 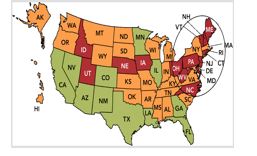
-In the Marketing Dashboard Map,the annual growth rate in each state is shown.There are 11 "good" states (CA,NV,AZ,NM,CO,TX,LA,MN,IL,GA,and FL) and 15 "bad" states,meaning very poor states (ID,UT,NE,IA,OH,WV,NC,PA,MD,NJ,CT,RI,VT,NH,and ME) .If you were a marketing manager faced with this dashboard,which of the following would be the best action?
A) focus on the shortfalls in Idaho and Utah
B) revise the relevant goals for both the East and West Coast
C) conduct additional market research in the Southern United States
D) examine your distribution system in the Northeastern United States
E) change the marketing metric being used to evaluate the states individually
Correct Answer:

Verified
Correct Answer:
Verified
Q12: With respect to distribution, shopping products are
Q35: Food products and fuel would be classified
Q36: Some restaurants ask consumers to evaluate their
Q63: Idea generation is the stage in the
Q65: Which of the following is a government
Q74: During which stage of the new-product development
Q77: During the business analysis stage of the
Q137: Considering the classification of consumer products, which
Q187: A good,service,or idea consisting of a bundle
Q193: IDEO is a company that<br>A) creates innovative