Multiple Choice
The following figure shows the intersection of demand and supply at the price P2 and quantity Q2 in a competitive market.
Figure 10-2 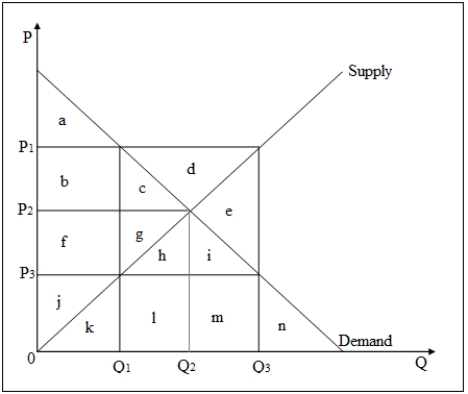
-Refer to Figure 10-2.What is the producer surplus at the equilibrium level of output?
A) f + g + j
B) f + g + h + i + j
C) f + g
D) i + h + g + f
Correct Answer:

Verified
Correct Answer:
Verified
Q5: Suppose the government limits the number of
Q7: Restrictions on entry in the taxicab market
Q24: The Candlemakers' petition was a satire of
Q54: The area under the supply curve represents
Q59: The equilibrium of a competitive industry is:<br>A)equitable
Q64: The following figure shows the demand and
Q65: Consider two increasing cost competitive industries (A
Q68: A contestable market is one in which:<br>A)a
Q71: Producer surplus is calculated as _.<br>A)the area
Q71: The following figure shows the effect of