Multiple Choice
The following figure shows the intersection of demand and supply at the price P2 and quantity Q2 in a competitive market.
Figure 10-2 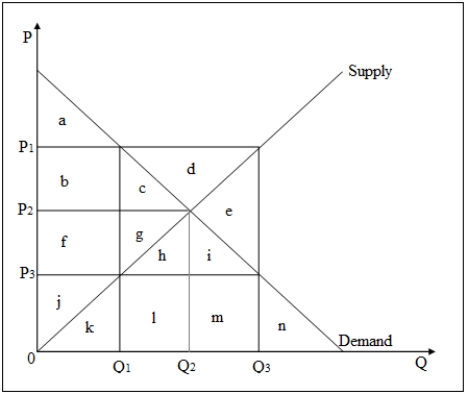
-Refer to Figure 10-2.What is the deadweight loss if a price ceiling is imposed at the price level P3 in this market?
A) b + f + c + g
B) b + c + d + e
C) c + g
D) d + e
Correct Answer:

Verified
Correct Answer:
Verified
Q10: What is meant by a deadweight loss?<br>A)It
Q12: Although U.S.airline fares fell significantly after deregulation,profits
Q17: In 2002,the U.S.imposed higher tariffs on steel
Q21: If a good is produced by an
Q28: A government study concludes that excessive alcohol
Q37: The following figure shows the demand and
Q37: The total surplus gained by all the
Q53: What is meant by consumer surplus?<br>A)It is
Q64: An excise tax levied on firms in
Q75: The level of output produced by a