Multiple Choice
The following figure shows the effect of a price ceiling in the market for yams.The market was initially in equilibrium at price P2 and quantity B.
Figure 10-1 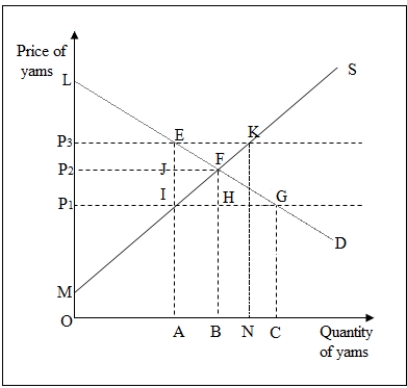
-In Figure 10-1,the deadweight loss due to a price ceiling set at P1 is area _____.
A) GFH
B) EFI
C) EFK
D) EFHI
Correct Answer:

Verified
Correct Answer:
Verified
Q15: Which of the following is true of
Q16: In 2002,the U.S.imposed higher tariffs on steel
Q18: Suppose a city limits the number of
Q45: Suppose the demand for raspberry frozen yogurt
Q86: The following figure shows the domestic U.S.market
Q87: When a price ceiling is imposed on
Q88: The following figure shows the intersection of
Q90: The following figure shows the demand and
Q92: The following figure shows the intersection of
Q94: The following figure shows the domestic U.S.market