Multiple Choice
The table given below represents the payoff matrix of firms A and B,when they choose to produce low or high output.In each cell,the figure on the left indicates Firm B's payoffs and the figure on the right indicates Firm A's payoffs. 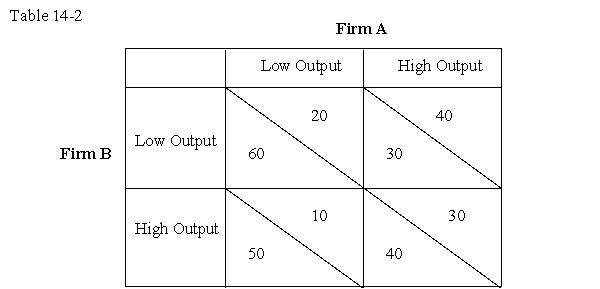
-Given the information in Table 14-2,which firm has a dominant strategy?
A) Firm A
B) Firm B
C) Both Firm A and Firm B
D) Neither Firm A nor Firm B
Correct Answer:

Verified
Correct Answer:
Verified
Q12: Which of the following lowers the marginal
Q25: The table given below describes the payoffs
Q31: The "lemons" model suggests that in cases
Q31: The table given below shows the payoffs
Q32: The table given below shows the payoffs
Q48: A tit-for-tat strategy is one in which:<br>A)each
Q58: Which of the following product markets is
Q69: Empirical analysis with respect to the used
Q85: To avoid getting a "lemon" house,buyers hire
Q88: A repeated game is a game:<br>A)that is