Multiple Choice
The table given below represents the payoff matrix of firms A and B,when they choose to produce either high output or low output.In each cell,the figure on the left indicates Firm B's payoffs and the figure on the right indicates Firm A's payoffs. 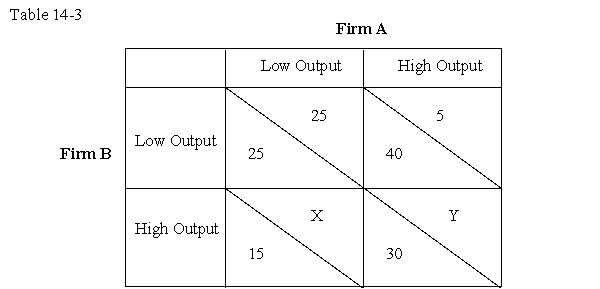
-If X = 15 and Y = 10,then the information in Table 14-3 implies that the game has:
A) a Nash equilibrium and a dominant strategy equilibrium.
B) a Nash equilibrium but not a dominant-strategy equilibrium.
C) no Nash equilibrium but has a dominant-strategy equilibrium.
D) neither a Nash equilibrium nor a dominant-strategy equilibrium.
Correct Answer:

Verified
Correct Answer:
Verified
Q11: All-you-can-eat restaurants tend to attract "undesirable" customers,i.e.
Q28: All games that have a dominant-strategy equilibrium
Q37: The _ price of a product is
Q46: The "live and let live" policy was
Q52: Which of the following is a defining
Q62: The table given below represents the payoff
Q64: The table given below represents the payoff
Q70: Which of the following is likely to
Q79: People are not always fully informed about
Q84: Karen hires a carpenter from a firm