Multiple Choice
The figure given below shows the demand and supply curves of labor.A per-unit tax imposed on the wage income of the employees shifts the supply curve of labor upward. 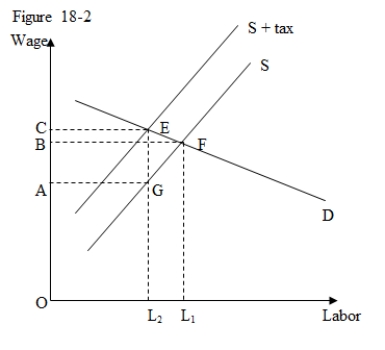
-In Figure 18-2,as a result of a per-unit tax:
A) the total wage paid by employers rises,while the net-wage received by employees declines.
B) the total wage paid by employers declines,while the net-wage received by the employees rises.
C) the total wage paid by employers declines.
D) the total wage received by employees decline.
Correct Answer:

Verified
Correct Answer:
Verified
Q3: The National Collegiate Athletic Association [NCAA] has
Q11: Minimum wage laws are promoted as the
Q16: A cartel agreement between input buyers would
Q21: The figure given below shows the impact
Q25: The figure given below shows the demand
Q26: The figure given below shows the demand
Q35: Which of the following best describes wage
Q53: The U.S.Social Security system:<br>A)invests the taxes paid
Q74: If the current Social Security system in
Q82: Which of the following categories of workers