Multiple Choice
The figure given below shows the demand and supply curves of labor.A per-unit tax imposed on the wage income of the employees shifts the supply curve of labor upward. 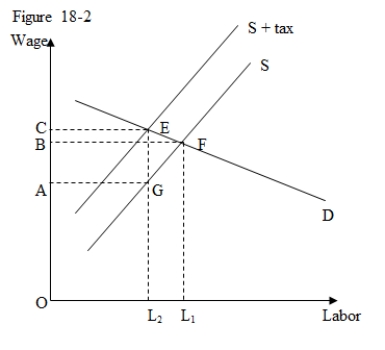
-According to Figure 18-2,the proportion of the per-unit tax paid by employees is:
A) CB/CA.
B) BA/OB.
C) AB/CA.
D) OA/OC.
Correct Answer:

Verified
Correct Answer:
Verified
Related Questions
Q10: Which of the following is true for
Q10: The figure given below shows the demand
Q21: Which of the following will result when
Q31: In determining who bears the burden of
Q33: Discrimination in hiring practices is influenced by
Q47: What is the long run effect of
Q51: The real burden of a social security
Q57: Which of the following facts indicate that
Q60: Which of the following is true of
Q68: Which of the following is consistent with