Multiple Choice
The following graph depicts the market for CT scanners in the United States. 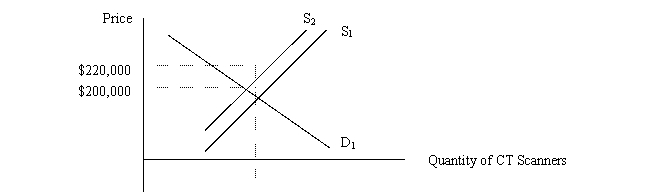 Assume an initial equilibrium at D1 and S1 with price of $200,000 per machine.If the government places a $20,000 excise tax on each new scanner sold, the new equilibrium price will be
A) at least $220,000.
B) exactly $220,000.
C) less than $220,000.
D) there's not enough information to determine what the new price will be.
Correct Answer:

Verified
Correct Answer:
Verified
Q2: Within the framework of economics, optimization means
Q3: use the following scenario.You are a consultant
Q4: Suppose robotic technology improves the results of
Q5: Suppose the market for hospital outpatient treatment
Q8: Suppose the U.S.Drug Enforcement Agency steps up
Q9: Suppose angioplasty and coronary artery bypass graft
Q10: Suppose the demand curve for medical care
Q11: use the following scenario.You are a consultant
Q12: Which of the following will not cause
Q15: A physician's office expenses increase 10 percent,so