Multiple Choice
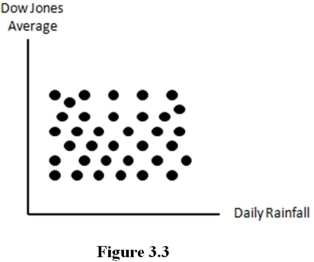
-The scatter diagram in figure suggests that ______ relationship likely exists between daily rainfall and the Dow Jones industrial average.
A) a positive linear
B) a negative linear
C) a quadratic
D) no linear
Correct Answer:

Verified
Correct Answer:
Verified
Related Questions
Q2: A smaller standard deviation of a distribution
Q3: A scatter diagram is potentially valuable because
Q4: An outlier that is much smaller than
Q5: The mean is the<br>A)middle number in an
Q6: A data set is said to be
Q8: Relative frequency histograms are potentially valuable because
Q9: The correlation coefficient is generally preferred to
Q10: When is the median most appropriate for
Q11: If a data set is skewed then<br>A)the
Q12: The covariance<br>A)measures the linear relationship between two