Solved
Which Correlation Coefficient Most Closely Represents the Relationship Depicted in the Scatterplot
Multiple Choice
Which correlation coefficient most closely represents the relationship depicted in the scatterplot below? 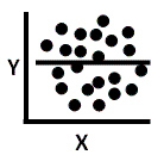
A) .75
B) .35
C) .02
D) -.44
Correct Answer:

Verified
Correct Answer:
Verified
Related Questions
Q138: When there is no linear relationship between
Q139: Correlation and regression are appropriate for both
Q140: An outlier may influence the _ of
Q141: Refer to the following data set. <img
Q142: Suppose you were interested in conducting a
Q144: What is restricted range and how does
Q145: The regression equation for predicting X from
Q146: The technique which minimizes the squared vertical
Q147: Pearson correlation is an appropriate statistic for
Q148: Researchers were recently surprised to learn that