Multiple Choice
A statistics professor classifies his students according to their grade point average (GPA) and their gender.The resulting cross-classification table is shown below. 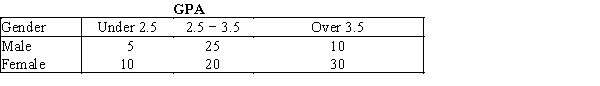 Which of the following describes the relationship between GPA and gender shown by this table?
A) A higher percentage of females have GPAs over 3.5,compared to males.
B) A lower percentage of females have GPAs over 3.5,compared to males.
C) Females and males each have the same percentage of GPAs over 3.5.
D) You cannot compare male and female GPAs because the total number in each group is not the same.
Correct Answer:

Verified
Correct Answer:
Verified
Q83: A(n)_ chart is not able to show
Q84: A college professor classifies his students according
Q85: If two nominal variables are unrelated,then the
Q86: Before leaving a particular restaurant,customers are asked
Q87: A(n)_ chart is often used to display
Q89: In purchasing an automobile,there are a number
Q90: A bar chart is used to represent
Q91: A researcher wishes to estimate the textbook
Q92: Values must represent ordered rankings for what
Q93: All calculations are permitted on interval data.