menu-iconExamlexExamLexServices

Discover

Ask a Question
  1. All Topics
  2. Topic
    Statistics
  3. Study Set
    Statistics for Management and Economics
  4. Exam
    Exam 3: Graphical Descriptive Techniques 2
  5. Question
    The Graph Below Is an Example of a Histogram
Solved

The Graph Below Is an Example of a Histogram

Question 124

Question 124

True/False

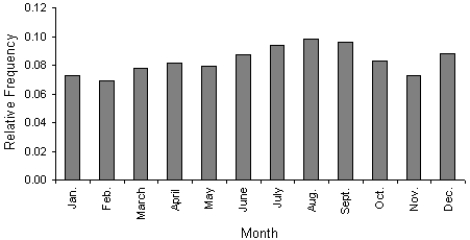
The graph below is an example of a histogram. The graph below is an example of a histogram.

Correct Answer:

verifed

Verified

Unlock this answer now
Get Access to more Verified Answers free of charge

Related Questions

Q119: Pie charts only show _,not _.This means

Q120: Which of the following represents a graphical

Q121: When a distribution has more values to

Q122: {Test Grades Narrative} Describe the distribution of

Q123: Compare the two histograms below.Which statement is

Q125: In a histogram,each observation is assigned to

Q126: Which of the following is a characteristic

Q127: A(n)_ is a graphical display consisting of

Q128: We determine the approximate width of the

Q129: A(n)_ histogram is one with a long
Examlex

ExamLex

About UsContact UsPerks CenterHomeschoolingTest Prep

Work With Us

Campus RepresentativeInfluencers

Links

FaqPricingChrome Extension

Download The App

Get App StoreGet Google Play

Policies

Privacy PolicyTerms of ServiceHonor CodeCommunity Guidelines

Scan To Download

qr-code

Copyright © (2025) ExamLex LLC.

Privacy PolicyTerms Of ServiceHonor CodeCommunity Guidelines