Multiple Choice
Which of the following statements describe(s) the line chart below? 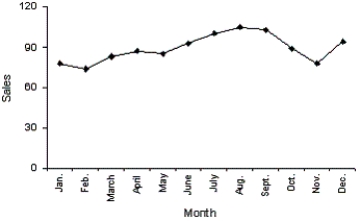
A) November experienced the lowest sales throughout the year.
B) August experienced the highest sales throughout the year.
C) Sales did not fluctuate more than 30 units on either side of 90.
D) All of these choices are true.
Correct Answer:

Verified
Correct Answer:
Verified
Related Questions
Q1: Correlation implies causation.
Q127: A(n)_ is a graphical display consisting of
Q128: We determine the approximate width of the
Q129: A(n)_ histogram is one with a long
Q130: A graph of the frequency distribution for
Q131: Insurance Company A representative from a local
Q133: It is speculated that the number of
Q134: A(n)_ is a table that sorts data
Q136: A line chart is created by plotting
Q137: One of the variables used to help