Short Answer
The line chart below shows potato prices per pound for each month from January (month 1)to December last year.By looking at this chart you can see the lowest potato prices occurred in ____________________. 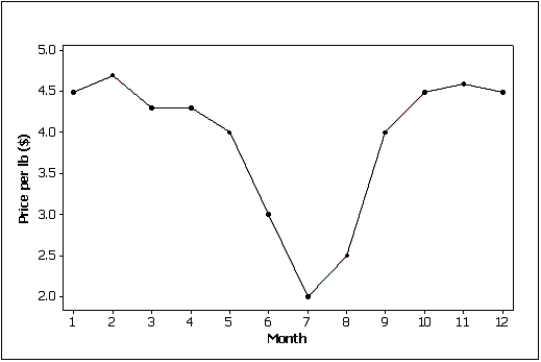
Correct Answer:

Verified
Correct Answer:
Verified
Related Questions
Q17: A skewed histogram is one with a
Q33: A line chart is created by plotting
Q34: A pie chart showing 80% yes and
Q35: Explain the difference between a histogram and
Q36: Below are two line charts where the
Q37: The two most important characteristics to look
Q39: Differences in the frequencies of a histogram
Q40: Compare the two histograms below.Which statement is
Q41: In order to draw a scatter diagram,we
Q42: Possible methods of graphical deception include:<br>A)A graph