True/False
The scatter diagram below depicts data with a negative linear relationship. 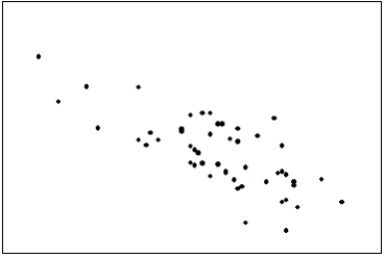
Correct Answer:

Verified
Correct Answer:
Verified
Related Questions
Q17: A skewed histogram is one with a
Q40: Compare the two histograms below.Which statement is
Q41: In order to draw a scatter diagram,we
Q42: Possible methods of graphical deception include:<br>A)A graph
Q44: A supermarket's monthly sales (in thousands of
Q46: A pie chart uses relative frequencies to
Q47: Is it fair to depict Texas as
Q48: What kind(s)of data can be depicted by
Q49: If the form of the graph replaces
Q50: A graph showing trends over time is