Essay
Briefly explain why the histogram below is misleading. 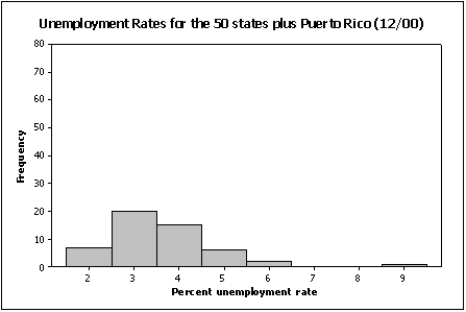
Correct Answer:

Verified
The scale on the Y-axis has be...View Answer
Unlock this answer now
Get Access to more Verified Answers free of charge
Correct Answer:
Verified
The scale on the Y-axis has be...
View Answer
Unlock this answer now
Get Access to more Verified Answers free of charge
Related Questions
Q33: A relative frequency distribution describes the proportion
Q45: Time series data are often graphically depicted
Q48: What kind(s)of data can be depicted by
Q49: If the form of the graph replaces
Q50: A graph showing trends over time is
Q52: Slopes and trends in a line chart
Q54: Which of the following represents time-series data?<br>A)The
Q55: {Test Grades Narrative} Construct frequency and relative
Q57: In applications involving two variables,X and Y,where
Q58: Graphical techniques should not be used to