Essay
Daily Hoagie Sales
The table below shows the number of hoagies sold daily during a four-week period at Hoagie Haven in Sutton,West Virginia. 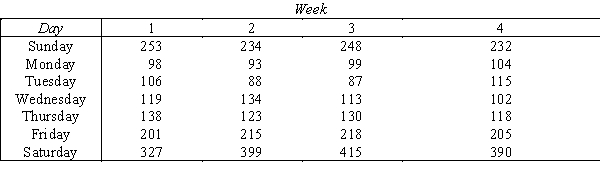
-{Daily Hoagie Sales Narrative} Use regression analysis to find the linear trend line.
Correct Answer:

Verified
Correct Answer:
Verified
Q74: Quarterly Sales <br>The quarterly sales (in millions
Q75: The model y<sub>t</sub> = T<sub>t</sub>×C<sub>t</sub>×S<sub>t</sub>×R<sub>t</sub> that assumes
Q76: Which of the following terms describes the
Q77: If we have 5 years of monthly
Q78: Which of the four time series components
Q80: Which of the following terms describes the
Q81: If the time series is composed of
Q83: In time series regressions the seasonal variation
Q84: In determining monthly seasonal indexes for gas
Q150: A least squares linear trend line is