Essay
A time series is shown in the table below: 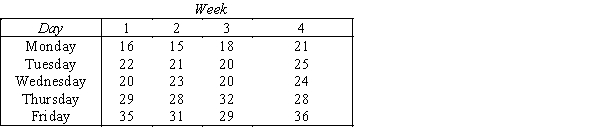 Compute the five-day moving averages to remove the seasonal and random variation.
Correct Answer:

Verified
Correct Answer:
Verified
Related Questions
Q6: Which of the following statements about the
Q127: Which method would you recommend to your
Q128: Daily Sandwich Sales <br>The daily sales figures
Q129: The most commonly used measures of forecast
Q130: To measure the seasonal variation,we compute seasonal
Q133: Which of the four-time series component is
Q134: Photo Equipment Store Earnings<br> The quarterly
Q135: The number of four-period centered moving averages
Q136: Which of the following equations deseasonalize a
Q137: After estimating a trend model for annual